Data products for your campaign are now available at CanProject.ca. This site is no longer updated.

Monday 25 February 2013

New Ridings in Ontario (Or, How to Get a Headache)

Twitter was abuzz with news of the latest report of the Federal Electoral Boundaries Commission for Ontario. The new boundaries map takes into account some of the public feedback sent to the commission, and the website explains the reasoning behind some of their more controversial choices.

As you might remember, the Northern Ontario ridings are a point of contention. With their vast territories and dwindling population, the question of how many ridings should be drawn for them is a sticking point for local residents (and MPs!).

A Brief History of Ridings

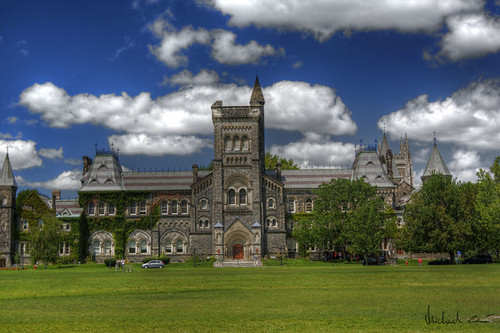
A scene from the Electoral Boundaries Commission's "Map Viewer" tool
Redistricting in Canada works on two levels: federal and provincial. Usually the number of MPs sent to the House of Commons in Ottawa by a province and the number of MPPs (or MLAs, MNAs, etc. in other provinces) sent to the provincial legislature have nothing to do with each other.

Compare this to the US, where a state like New Hampshire, which sends two representatives to the US House of Representatives, can have one of the largest state legislatures with 400 members.

In the 1990s, the number of MPPs in Ontario was cut down to the same number of federal MPs from the province.

Surprisingly, (as in we're surprised something so sensible could happen, given the circumstances) the provincial riding boundaries became identical to the federal ones.

The Plot Thickens

As the Elections Ontario website explains, in 2005, the Liberal government of Ontario decided to respond to the 2003 Federal redistricting, which took a federal seat away from the north, by keeping the number of provincial ridings in Northern Ontario fixed at 11.

Meanwhile, southern provincial seats were not locked in, and were allowed to shuffle to match the 2003 federal redistribution.

When the last reliable federal census was taken in 2006, the provincial riding boundaries in the North were based on the federal boundaries from before the 2003 Order. The provincial riding boundaries in the south of Ontario, meanwhile, were "identical to their federal counterparts, as they existed on September 1, 2004."

Minority Report

For our purposes, the Federal Electoral District (FED) reports based on the 2006 census can be used at the provincial level. We have to do this since Elections Ontario doesn't compile and release to the public reports based on the current provincial boundaries (as do Québec, British Columbia, etc), at least as far as we can tell.

The catch is that the 2006 FED reports can only really be used on the 96 southern provincial ridings.

The northern provincial ridings correspond to the older, 2001 FED reports.

As you might imagine, the data is slightly different, and 5 years older. Some of the questions that made it into the 2006 FED reports weren't in the 2001 versions, such as questions about transportation and housing.

In our data we've responded by essentially ignoring the Northern Ridings, or presenting them as a separate, but related data set. (That can't be what the government had in mind, can it?)

Episode II : Attack of the Commissions

This year, a new Representation Order at the federal level is due, which will give a greater number of seats to Ontario (121) in an expanded House of Commons (338 mps vs the current 308). The boundaries will have to be redrawn at the federal level.

The question is: what happens at the provincial level? Elections Ontario gives us some hints: "With the passing of Bill 214 and the Representation Act, 2005, Ontario’s electoral boundaries are no longer identical to the federal electoral boundaries."

Mmmkay. On continue...
The new electoral boundaries will remain until they are replaced by new legislation. Any changes to the names of southern electoral districts that may be made at the federal level after September 1, 2004 are also adopted at the provincial level, but only if the boundaries of the electoral district are unchanged. ('Tis we, who underline)
New Legislation

The good people of Ontario, particularly the politically-minded, and those with websites, face the prospect of having to throw everything out and start again before the next provincial election (which could happen anytime, so, now, basically).

But things might not be so dire. As the Commission points out,
The new boundaries are applied at a general election called at least seven months after the representation order is proclaimed. (section 25)

This time allows Elections Canada, political parties, candidates and sitting MPs to prepare for the next general election (e.g. hire or reappoint returning officers, adjust the National Register of Electors, reorganize electoral district associations). The next general election is planned for October 2015.

The earliest a general election could be called where the new boundaries would take effect is April 2014. 
 It is hard to see how Queen's Park would jump ahead of the Feds on this issue, particularly during a period of minority government instability.

On the other hand, as we'll point out, the new Wynne government could use the redistribution issue as an interesting gambit to try to win the next election.

Represent Your Hood

A common metric used to evaluate the democratic quality of a parliament, house, congress, etc. is the ratio of representatives to voters (or citizens). In Canada, there were 24,257,592 registered voters for the 2011 elections, and 308 MPs, for a ratio of 78,758:1.

Not every MP has 78,758 constituents (the boundaries commission is allowed to vary the number to meet certain other goals) but that's the rough number. Compare that to the US, where this website informs us there are 180,345,625 registered voters, for 435 congressmen. This makes for a ratio of 414,587:1. It's much harder to see your congressman than your MP, and it's much harder to get elected.

Goodbye, Trinity-Spadina
Obviously at different levels in a federal system this changes somewhat. In Québec, 5,919,808 voters share 125 députés. That is, 47358 : 1. That's about 60% of the federal rate of representation.

It's conversely about twice as easy to get elected at the provincial level in Québec, and twice as easy to meet your MNA face-to-face. This makes sense, as provincial issues (health, education, etc) are "closer" to home and more frequent contact with voters seems desirable.

But consider the case of Ontario, as it will be after the federal redistribution, for its 8,761,095 voters:

8,761,095 voters for 121 Federal MPs, or about 72,406:1
8,761,095 voters for 107 Provincial MPPs, or about 81,879:1

With the unadjusted boundaries, Ontario will face the dubious honour of having a provincial parliament that is less representative than its deputation to the House of Commons.

Even belt-tightening Ontarians might agree that in a democracy, where the ideal ratio should (theoretically) be somewhat closer to 1:1, this isn't a desirable situation.

What to do about it - A Political Fiction Tale

Let's say you're a new Ontario premier, who is lagging in the polls. The seat projections at Ontario Projections aren't very favourable for you. What are some possible ways to avoid an election or gain more seats?

Shake up the map.

You could pass a bill adjusting the provincial boundaries to match the new federal boundaries ("Our federal friends have spoken, and opened the way to a new collaborative way of representing Ontarians in parliament.... " ).

Another option is to reopen the question for the whole province, or at least the southern ridings.

Should Queen's Park MPPs be elected from the same districts as their federal counterparts? Should the provincial legislature instead be more representative than the House of Commons? 

Why not launch a round of public consultations on the Ontario Riding Question?

MPPs would likely love it, as they might find their re-election tasks will have become easier in short order. In any case, it would buy them some more time until the next election.

Voters would probably like it as well, as they'd get to have a say on the issue. Should our democracy really be based on the cheapest possible number of MPPs?

In the process, the government might be able to find new pockets of voters, who will then be able to express their heretofore pent-up Liberal votes (e.g. in the centers of towns of otherwise Tory ridings).

While we're at it

Maybe, just maybe, Elections Ontario could then be directed to produce new riding reports based on the 2006 census data (like the DGEQ did), and make them public and preferably in Excel format.  It would be even more fun if they brought back the zip code to riding correspondence file. Just saying.

Friday 22 February 2013

Projection: "Minor Majority" for Hudak

Edit: Due to an update of our model, we now see the PCs once again in minority territory.

Based on new polling reported today in the Toronto Star, our projection whirlygigs have informed us that Tim Hudak's Progressive Conservatives are poised to form a majority government at 54 seats, versus only 27 for the Liberals. With only one seat between Hudak and the rest of the chamber, some accommodation would be needed for the Speaker position, however.

Of course, we know that this differs from the Star's headline which suggests a minority for the PCs. Indeed, our uniform swing model does come out with a minority government. We respond to this divergence in opinion by responding: you be the judge!

Seats going over to the PCs this round: Ajax-Pickering, Ancaster-Dundas-Flamborough-Westdale, Brampton-Springdale, Brampton West, Brant, Glengarry-Prescott-Russell, Kitchener Centre, Mississauga-Erindale, Niagara Falls, Oak Ridges-Markham, Oakville, Ottawa-Orléans, Ottawa West-Nepean, Peterborough, Richmond Hill, St. Catharines, and York Centre.

Click to view the full projection scorecard

Sunday 17 February 2013

Infographic: The Late-20s Employment Dip

Is thirty the new twenty-five? In Québec and Ontario (the territory of our Projections blogs thus far) it's been harder for people in their late twenties to get their foot on the ladder.


(Unfortunately, detailled age breakdowns don't seem to be available in the same place as education information. So we can't tell you how many diplomas are held by those taking the biggest hits on jobs.)

Full-time numbers for all 25-29s took a hit between 2000 and 2012, but again it was young men on the job market who were hit the hardest. In general, girls were kept afloat, but the provincial breakdown brings to light an important change: girls in Ontario came off slightly worse, while their sisters in Québec made absolute gains in an era where others around them were losing their jobs.

Young men in Ontario were hit the hardest in relative terms, but retain a slight relative advantage over their brothers in Québec, and of course, the young women.


Ignoring gender, the picture is much less ambiguous. Even if we are generous, and use the 2004 dip in employment as the starting point for the Ontario Liberals, the McGuinty economy left much to be desired for anyone born after 1983 and seeking full-time employment.

Bad news for Québec-bashers: The 2000s to today, all things considered, show an upward trajectory for youth employment. In Québec, 2011 was a worse year for jobs than crisis-era 2009. Meanwhile, a very anemic recovery seems to be underway in Ontario.

Saturday 16 February 2013

How to Reform the Senate

Sketch: D. GrayAfter a few Canadian Senators got into some trouble in recent weeks, the word on the street is Senate Reform, or even abolishing the red chamber altogether.

We think that would be a bit hasty. Why don't we come up with something practical to reform the Senate, and make it a place that inspires respect instead of ridicule? And get some of that sober reflection we we promised?

Everyone's got their sketch on the back of a cocktail napkin, so here's our blue-sky thinking:
  • Keep the Senate more or less how it is now, except:
  • A list of potential Senators would be nominated by premiers
  • The nominees would have to be members of the Order of Canada, the Order of Ontario, or a similarly merit-based provincial order. 
  • The nominees would then would be given "Yes/No" votes at the next Federal General election, within the areas they are supposed to represent.
  • Campaign activities, particularly spending and fund-raising, would be banned.
  • Voters would be mailed a booklet with 1-page statements by the nominees. Statements deemed fluff by an all-party committee, such as patriotic formulations, happiness to be considered, looking forward to representing you and other senators, etc., Canada is the greatest country in the world, etc., would be redacted.
  • The nominees with the highest Yes / No ratio would become Senators.
  • Senators would serve for 20 years.
  • Temporary vacancies could be filled with nominees named by premiers, with the same requirements for Senators.  
  • Optional: Caucuses could be formed within the Senate, but could not be based on parties recognized by Elections Canada. 

Friday 15 February 2013

The PCs and the Young Man-Cession

Inside the Tube
Off to look for work...
Just a quick update for now to show you two graphs we whipped up today on employment figures in Québec and Ontario.

As you can see there are several trends worth pointing out: one is that people in the 45-64 phase of their life feel compelled to stay in full-time jobs, or get into full-time jobs at much higher rates than in 2000.

At the same time, we can see at the bottom of the line graph that people 65 and older have more than doubled their full-time workloads.

Predictably, given the dearth of job growth in Ontario and Québec (53.8% Full-time employment as a percentage of the working-age population in 2000, compared to 52.5% in 2012), this means twenty-somethings have been increasingly pushed out of the full-time workforce.


Looking at the dark and light blue lines on the graph, the young folks act as a sort of canary in the coal mine for broader employment. That is, it's going down, down, down.

No Country For Young Men

Even among twenty-somethings, the effects aren't being evenly distributed. The employment rate for young men took quite a large dive in 2008-2009 and hasn't really even begun to recover. Meanwhile, the 21st century job market for young women has been rather great, on balance, especially in Québec.


A Political Opportunity?

We're all familiar with the endless media stories of youth wage scarring, that is, reduced income over time for people who were unemployed as youth.

The trend we've identified will probably make more than a few young people unhappy over time, and, if our second chart is any guide, these will disproportionately be young men, at least compared to the status quo.

Angry young men? Sounds like a prime pickup opportunity for the Conservatives!

But wait - the PC vote in prior elections is worth looking at here.

Let's pretend you are a late-20s, white, unmarried, university-educated male who lives near an urban center and is unemployed (no or low income) and not really inclined to vote. Since this is a quick update, we won't bother getting into the multivariate, predictive analyses and that kind of thing. But if we go down the shopping list of Pearson correlations, who stands out as likely to catch the Young Man-cession Vote? (Figures are for the non-North of Ontario only)

Males 25-29:  PCs: -0.465*. No other significant correlations.

Never legally married: No significant correlations, but if in a common-law relationship, the figures are Liberals -0.269 **, NDP +0.313 *, with no significant correlation to the PCs.

Renting (a likely scenario): +0.222 ** for the NDP, while for the PCs it is -0.488 **, no Liberal correlation.

Old home (before 1986): NDP +0.510 **, PCs: -0.272 **.

Other household types (e.g. roommates): Liberals 0.253 **, NDP 0.349 **, PCs -0.815 **.

Low median income in 2005 - Other household types: Liberals -0.151 *, NDP 0.457 **, no PC correlation. (We have reversed the signs)

High median rent (because in an area with transit): Liberals 0.429 **, NDP -0.379 *.

Moved within the past 5 years within same city: Liberals 0.305 ** , NDP 0.222 * , PCs -0.650 **

Education 25-34 : University at Bachelor's level or above: PCs : -0.509. 

Field of study: Humanities and the social sciences have few significant correlations, except Humanities -0.469 ** for the PCs. Let's give the PCs a break and assume Social Sciences. 

Mother tongue English only: Liberals -0.262 **, NDP -0.213 **, PCs 0.557 **. 

Knowledge of English only: NDP -.374 ** , PCs 0.098 **. 

Non-immigrants: Liberals -0.335 **, NDP -0.123 *, PCs 0.603 **. 

Not a visible minority: -0.283 ** for the Liberals and 0.565 ** for the PCs.

Population 15 and over unemployed: Liberals 0.163 **, PCs -0.598 **.

Public transit (technically employed people in the Census, but we'll pretend it applies the same): Liberals 0.549 * , NDP 0.167 ** and PCs -0.659 **

(For the number-crunchers: the stars here are the usual significance markers.)

The Results

We could go on, but the results seem pretty overwhelming, when we add these up all together in some kind of "correlation scorecard": 0.379 for the Liberals, 1.151 for the NDP, and a rather impressive -1.659 for the PCs.

The PCs seem to have turned off every potential demographic category for victims of the Young Man-cession. Indeed, when we looked at the potential for gains among the parties, there were not a whole lot of groups up for grabs anyway. We might then guess that the PC camp within the next few months is more likely to follow a base-turnout strategy rather than an attempt at making conversions.

Tuesday 12 February 2013

The Messy Job of Finding the Ontario Swing Voter


Today we're going to look for the Ontario swing voter.

20111110-OC-AMW-0239
On Election night, when we're standing there in front of the TVs, red-faced, waiting for the vote totals to trickle in from some uncalled riding, who's fault is it? Whose hesitation between parties is keeping us from getting some sleep that night?

Building on our prior experience with correlations, we decided to look for the census data that corresponded the closest with small electoral margins.

Small margins = swing voters, according to our thinking. Opportunities for growth for the parties.

The result of our search was rather surprising.

Monday 11 February 2013

New Data Available

For the number crunchers out there, we have uploaded a file containing our Pearson correlations between various vote measures and demographics, and differences between 2011-2007. It is now shared on the Open Data page. This is the data (more or less) that we've used to explore where the parties may have gained and lost support.

The Front Lines of Ontario - Battleground Clusters

Number crunching and statistical analysis can get you some pretty strange things.

Stand-off
You've probably heard of the idea of "battleground ridings". But in this entry, we're going to take a look at battleground clusters, a name we've just made up for different k-means clusters of Ontario electoral districts.

How We Did It

We told our statistical software program to divvy up all Ontario ridings by party votes in 2011, as a percentage of electors. This puts a party's relative attractiveness into the context of how well it was able to get out the vote on election day.

We might think of these Battleground Clusters as battle fronts on a map. A battle that I must sadly view from the sidelines (for now!), as I don't work in any paid capacity for a political party, consultancy, etc. I will let the professionals be my judge.

(I am also pleased to finally be able to offer some insight into Northern Ontario ridings, because this data doesn't depend on inconsistent, well-dated census data).

Sunday 10 February 2013

Happy Chinese New Year!

" Chinatown, London, England, United Kingdom "

The pols are on Twitter, Facebook, shaking hands, and out wishing you a Happy Chinese New Year! But who is winning the Chinese vote?

Total Population - Chinese
Correlations to Vote
(% Electors)
20072011Difference
Liberal0.170.220.05
PC-0.28-0.32-0.04
NDP-0.10-0.11-0.01
Green-0.21-0.160.05
Non-Turnout0.430.41-0.02

Friday 8 February 2013

By-Elections: Windsor-Tecumseh and Sudbury within NDP Commuting Distance

Finance Minister Dwight Duncan holds a media avail to highlight Ontario Liberals' strong plan to create jobs
Forward Together, just not with me.
Strange things are afoot in the Liberal cabinet. Dwight Duncan, the Finance Minister of Ontario, and MPP for Windsor-Tecumseh has just announced his resignation from his seat in Queen's Park, as has Energy Minister Chris Bentley, of London West. Likewise, another cabinet official, Rick Bartolucci, has just stepped down and will vacate his seat at the next general election.

These resignations will present some enticing opportunities to the opposition.

Bums on Seats

As the title of this entry suggests, we at OntarioProjections seem to think that the NDP has a chance to steal this seat from the Ontario Liberals, as well as Sudbury.

Thursday 7 February 2013

Hudak's Heroes - Cows, Coal and Government Cash

Don't change horses midstream, goes the saying. Something that could apply to the 2011 Ontario Election and this website as well. How's that, you ask? Well, we've recently tweaked our methodology just in time for the last episode of this mini-series on the greatest electoral shifts among the parties in 2011. Soon we'll be going back and adding in the adjustments, and changing our commentary accordingly.

Bombeando o campo

In any case, we're going to be looking at where Tim Hudak managed to get out the vote for his party in 2011, by comparing over time the correlations to a bunch of demographic indicators from the 2006 Census (the 2006 census being the latest reliable census in Canada, naturally).

Because the data for Northern Ontario ridings comes from the 2001 census, it is rather dated, and lacks a lot of the finer detail of the 2006 survey. So, once again, the following is for the Rest of Ontario only: 

Wednesday 6 February 2013

What are immigrants anyway? Conservative Progress on City Dwellers

PC - it's a brand of food at the grocery store, a type of computer, a rather dated pop culture epithet, and also a political party in Ontario. The Progressive Conservative party, under its relatively new leader, Tim Hudak, didn't manage to seal the deal for a majority government in 2011.

Rather like his transatlantic counterpart Michael Howard in 2005, the PCs failed to capitalize on fatigue with a would-be third term government, and were outshone by a third-party upstart, in that case Charles Kennedy's Lib Dems (though we all know how that turned out). 

Second day of the OES begins with remarks from  Tim Hudak, Leader of the Official Opposition


Here is a rather extensive comparison of the 2011 Progressive Conservative platform against the NDP and the Ontario Liberals, although it all reads much like the instruction manual for a microwave.

How to Lose Toronto

One bump in the road encountered by the Hudak team was its controversial criticism of tax credit programs for hiring immigrants. Having been seen, rightly or wrongly, to boldly go after one of the sacred cows of globalization, the shifts in support between the 2011 and 2007 elections certainly reflect that:

Monday 4 February 2013

My g-g-generation - Young people for Anyone But McGuinty?

In Ontario politics, Dalton McGuinty may be yesterday's news, but his Liberal troops live on to fight another day. The new leader, Kathleen Wynne has a lot of territory to cover if she wants to get her government back up to a majority.

Dalton McGuinty Speaks with Students
"Let's pretend you'll have careers..."
Where will she start? We already looked at where the Liberals in 2011 gained support compared to their 2007 score. Obviously this wasn't enough, as they went from a majority to a minority, meaning that afterwards they merely held the plurality of seats at Queen's Park, the provincial legislature. So we're going to look at what went wrong for them in the October 2011 elections.

Sunday 3 February 2013

Kathleen Wynne - The Over- Education Premier?

Last time, we took a look at a rough outline of how the "SuperZips" measure invented by Charles Murray might play out in Ontario at the riding level. Let's go a step further today, by breaking down the "SuperRiding" score by standardized education level and income level. 

So Many Books, So Few Dollars

Yesterday, I noticed that my own riding, Parkdale–High Park was above the 75th percentile in SuperRiding scores. But when it came to the cold, hard cash element, P-HP was behind.

Then there was Mitt Romney's line from the debates last year; how young people "... can't find a job commensurate with their education." If 20-somethings here are over-educated for today's economy, how are the other Ontario ridings faring?

Hon. Kathleen Wynne, Minister of Transportation
Alms for those with advanced degrees?
Below, we've posted a breakdown of the figures that led to my SuperRidings score from yesterday. We've also added a new column, the Over-Educated Score, and then weighted it by the figure for Median Family Income. A positive number suggests income lagging behind education. A negative number suggests the opposite — perhaps large numbers of baby boomers who got their diploma stamped by the mill in the 1970s, and were rewarded by an easy labour market?

Data is for the Rest of Ontario only (No Northern Ridings).

Edit: A new method was used to compute these scores. It consisted of first finding the percent score within a given riding (e.g. converting a score of 50,000 people within a riding twice that size to 50% of a riding). Then computing a standard score, based on the percent scores. Then weighting the standard scores by the population of the riding, by dividing the standard scores by the following: (Population of the riding / Average population of ridings).

Figures are based on the 2006 census, and are given for the Rest of Ontario only (i.e. Not the 11 Northern Ridings). The original figures given are found below.  

Find your Electoral District at Elections Ontario.

RidingWeighted Standardized Score:
Education 15 and over: Degree at bachelor's level or above
Weighted Standardized score: Median after-tax income in 2005 - All census families Over-Educated Score 
(Income Score minus Education Score)
Percentile Rank2011 Party Winner
Toronto Centre2.20-0.512.71100%OLP
Trinity-Spadina2.37-0.292.6799%NDP
Don Valley East1.39-1.152.5498%OLP
Scarborough-Agincourt0.51-1.712.2297%OLP
Parkdale-High Park2.03-0.182.2196%NDP
Willowdale1.99-0.092.0895%OLP
York Centre0.47-1.371.8594%OLP
Toronto-Danforth0.97-0.741.7193%NDP
Don Valley West2.270.621.6592%OLP
Ottawa Centre2.570.961.6191%OLP
Scarborough Southwest-0.09-1.581.5089%OLP
Scarborough Centre-0.17-1.621.4688%OLP
York West-0.92-2.371.4587%OLP
Ottawa-Vanier1.23-0.191.4286%OLP
St Paul's2.651.251.4085%OLP
Mississauga East-Cooksville0.47-0.931.4084%OLP
Scarborough-Guildwood-0.27-1.641.3783%OLP
Etobicoke North-0.36-1.661.3082%OLP
Beaches-East York1.03-0.261.2981%NDP
Davenport-0.31-1.561.2680%NDP
Scarborough-Rouge River-0.06-1.301.2479%OLP
Hamilton Centre-0.47-1.681.2078%NDP
Ottawa West-Nepean0.84-0.241.0877%OLP
York South-Weston-0.91-1.870.9676%OLP
Eglinton-Lawrence1.901.010.9075%OLP
Ottawa South0.950.190.7674%OLP
Etobicoke-Lakeshore0.900.190.7073%OLP
London North Centre0.45-0.190.6372%OLP
Richmond Hill1.220.660.5671%OLP
Windsor West-0.07-0.580.5169%OLP
Markham-Unionville0.44-0.050.4968%OLP
Kingston and the Islands0.30-0.170.4767%OLP
Etobicoke Centre0.740.300.4466%OLP
Mississauga-Brampton South0.550.140.4165%OLP
Bramalea-Gore-Malton-0.32-0.660.3464%NDP
Thornhill1.361.100.2663%PC
London West0.420.180.2462%OLP
Prince Edward-Hastings-1.00-1.200.2061%PC
St. Catharines-0.61-0.730.1260%OLP
Bruce-Grey-Owen Sound-1.19-1.240.0559%PC
Peterborough-0.68-0.720.0458%OLP
Guelph0.350.39-0.0457%OLP
Mississauga-Erindale0.690.75-0.0756%OLP
Kitchener-Waterloo0.750.85-0.0955%PC
Niagara Falls-0.80-0.70-0.1054%OLP
Simcoe North-0.90-0.73-0.1753%PC
Stormont-Dundas-South Glengarry-1.33-1.16-0.1752%PC
Brampton West-0.28-0.07-0.2151%OLP
Kitchener Centre-0.55-0.32-0.2349%OLP
Brampton-Springdale-0.31-0.08-0.2348%OLP
Mississauga South0.580.83-0.2547%OLP
Hamilton East-Stoney Creek-1.15-0.88-0.2846%NDP
Renfrew-Nipissing-Pembroke-1.23-0.92-0.3145%PC
Haliburton-Kawartha Lakes-Brock-1.12-0.79-0.3344%PC
Mississauga-Streetsville0.550.89-0.3443%OLP
Windsor-Tecumseh-0.42-0.07-0.3542%OLP
Lanark-Frontenac-Lennox and Addington-0.92-0.57-0.3541%PC
Leeds-Grenville-1.03-0.64-0.3940%PC
Welland-0.99-0.58-0.4139%NDP
London-Fanshawe-1.22-0.81-0.4138%NDP
Northumberland-Quinte West-1.03-0.62-0.4137%PC
Oak Ridges-Markham0.550.98-0.4436%OLP
Chatham-Kent-Essex-1.24-0.61-0.6335%PC
Brant-0.91-0.28-0.6334%OLP
Hamilton Mountain-0.96-0.29-0.6733%NDP
Barrie-0.710.05-0.7532%PC
Burlington0.040.80-0.7731%PC
Nepean-Carleton0.851.67-0.8129%PC
Haldimand-Norfolk-1.37-0.52-0.8528%PC
Huron-Bruce-1.25-0.38-0.8627%PC
Simcoe-Grey-0.760.12-0.8826%PC
Oshawa-1.17-0.24-0.9325%PC
Ancaster-Dundas-Flamborough-Westdale0.691.63-0.9424%OLP
Lambton-Kent-Middlesex-1.28-0.31-0.9723%PC
Cambridge-0.770.21-0.9822%PC
Carleton-Mississippi Mills1.012.01-1.0021%PC
Glengarry-Prescott-Russell-0.960.05-1.0220%OLP
Kitchener-Conestoga-0.620.40-1.0219%PC
Halton0.691.72-1.0318%PC
Elgin-Middlesex-London-1.17-0.09-1.0817%PC
Perth-Wellington-1.30-0.22-1.0816%PC
Vaughan-0.210.90-1.1215%OLP
Oxford-1.35-0.19-1.1614%PC
Sarnia-Lambton-1.050.12-1.1713%PC
Pickering-Scarborough East0.051.39-1.3412%OLP
Ajax-Pickering-0.311.09-1.4011%OLP
Newmarket-Aurora0.261.68-1.429%PC
York-Simcoe-1.000.45-1.458%PC
Oakville1.022.50-1.487%OLP
Whitby-Oshawa-0.251.27-1.516%PC
Ottawa-Orléans0.742.26-1.525%OLP
Niagara West-Glanbrook-0.670.88-1.554%PC
Dufferin-Caledon-0.681.03-1.713%PC
Essex-0.621.12-1.742%NDP
Durham-0.801.01-1.811%PC
Wellington-Halton Hills-0.381.55-1.930%PC

There's the real reason middle Ontario should be wary of multi-graduate, premier-designate Kathleen Wynne: she represents one of the most over-educated ridings in Ontario (Don Valley West). </joke>.

Meanwhile, outgoing Premier Dalton McGuinty's riding, Ottawa South, barely misses the top 25% over-educated ridings.


Certain social critics might also take perverse pleasure in noting that Trinity-Spadina (Toronto's Annex, Trinity Bellwoods Park, Ossington Avenue, etc) is number 2

Ph.D. in Horribleness
In Rob Ford's imagination, there are probably
more than a few of these in Trinity-Spadina
Under a stricter set of criteria, that is, searching for truly "over-educated" ridings consisting of lots of educated people making very little money (standard scores over zero for education, and less than zero for income), come out with this exclusive list : Toronto Centre, Trinity-Spadina, Don Valley East, Scarborough-Agincourt, Parkdale-High Park, Willowdale, York Centre, Toronto-Danforth, Ottawa-Vanier, Mississauga East-Cooksville, Beaches-East York, Ottawa West-Nepean, London North Centre, Markham-Unionville, followed by Kingston and the Islands.


Since the figures are from 2006, maybe the trends would be even more extreme if we had reliable 2011 census numbers.

Brains, Paupers, and the Party Vote

The NDP seems disproportionately represented at the top of the pile here, though they are sprinkled throughout the list, winning ridings all the way down to "under-educated" Essex.

Conversely, the PCs show up pretty often at the bottom, while maxing out at Thornhill, a third of the way down from the top. Is there something going on here?

We decided to check, so we assigned codes to the 2011 Ontario Election winners and looked for any correlations between Party Winner and all our various measures:

Correlationsr
Education and Party Winner-0.30 *** ( p = 0.003 )
Income and Party Winner-0.08
Over-Educated Score and Party Winner-0.21 ** (p = 0.04)

The strongest correlation we found was not with any of the fanciful scores invented here, but actually just plain old education. The next-highest? The over-educated score.

Something interesting for the parties to keep in mind: 2006 family median income apparently had no significant correlation to 2011 party vote at all.

Of course, we would have to reword that for the statisticians: the null hypothesis, where income has no relationship to party vote, cannot be rejected.

But this goes to show you why you should check your figures with some kind of statistical test before jumping to too-hasty a conclusion.


A Nice Note

We have to point out, of course, that "Educated" (% BAs) isn't conterminous with training or seriousness (sorry to burst your bubble, Trinity Bellwoods Park hipsters).

One likely source of income disproportionate to the number of BAs found in a riding are the skilled trades.

Case in point: the roommate at our house who brings home all the money is in wood-working. 

Original tables:

Here is the old data from 3 Feb 2013, using a slightly less sophisticated (we think now) method:

Education Score (after Murray) Rest of Ontario onlyStd % Education ScoreStd Median Income ScoreSuper-Riding ScoreSuper-Riding
Score (weighted)
Over-
Educated Score
Over-
Educated Score (Weighted)
2011 Winner
Willowdale2.28-0.12-2.14-1.922.402.35OLP
Trinity-Spadina2.12-0.32-1.56-1.732.432.30NDP
Toronto Centre1.87-0.53-1.87-1.702.402.18OLP
Don Valley East1.39-1.101.722.092.492.01OLP
Don Valley West2.270.621.891.971.651.83OLP
Parkdale-High Park1.67-0.17-1.33-1.171.841.79NDP
Scarborough-Agincourt0.56-1.66-1.52-1.402.221.57OLP
Ottawa Centre2.220.92-0.86-0.771.301.51OLP
York Centre0.62-1.33-2.09-2.001.951.50OLP
St. Paul's2.331.19-1.69-1.571.131.37OLP
Toronto-Danforth0.87-0.66-1.60-1.721.531.36NDP
Mississauga East-Cooksville0.55-1.000.200.191.551.28OLP
Eglinton-Lawrence1.910.851.481.631.061.22OLP
Beaches-East York0.91-0.253.523.321.161.11NDP
Ottawa-Vanier0.99-0.12-1.18-1.101.111.09OLP
Scarborough Centre-0.05-1.47-1.37-1.361.421.05OLP
Ottawa West-Nepean0.89-0.18-0.55-0.791.071.04OLP
Scarborough-Rouge River-0.08-1.48-1.60-1.421.401.04OLP
Scarborough Southwest-0.02-1.35-1.50-1.371.331.02OLP
Scarborough-Guildwood-0.19-1.51-1.48-1.421.310.97OLP
Etobicoke North-0.30-1.611.331.251.320.94OLP
Davenport-0.22-1.392.032.101.170.89NDP
Ottawa South0.980.14-0.73-0.770.840.86OLP
Hamilton Centre-0.45-1.630.970.971.180.84NDP
York West-0.76-2.05-2.81-2.481.290.83OLP
Richmond Hill1.300.59-1.24-1.290.710.79OLP
Etobicoke-Lakeshore0.920.171.231.160.750.77OLP
Etobicoke Centre0.940.291.511.310.640.68OLP
York South-Weston-0.83-1.80-2.09-2.080.970.66OLP
Markham-Unionville0.45-0.220.190.190.670.64OLP
London North Centre0.46-0.180.290.270.640.62OLP
Thornhill1.601.12-1.67-1.690.480.57PC
Mississauga-Brampton South0.620.05-0.21-0.200.570.57OLP
Windsor West-0.05-0.60-1.96-1.940.560.50OLP
Bramalea-Gore-Malton-0.42-0.932.773.130.500.42NDP
Kingston and the Islands0.24-0.170.720.700.410.40OLP
London West0.480.180.230.240.300.31OLP
St. Catharines-0.55-0.69-1.69-1.550.140.13OLP
Prince Edward-Hastings-1.00-1.09-1.45-1.280.090.08PC
Mississauga-Erindale0.890.83-0.48-0.480.060.07OLP
Peterborough-0.63-0.67-1.24-1.190.050.04OLP
Kitchener-Waterloo0.870.890.660.59-0.02-0.03PC
Bruce-Grey-Owen Sound-1.09-1.052.892.87-0.04-0.03PC
Guelph0.340.381.121.12-0.05-0.05OLP
Niagara Falls-0.87-0.73-0.58-0.64-0.15-0.13OLP
Stormont-Dundas-South Glengarry-1.17-0.97-1.70-1.57-0.19-0.16PC
Kitchener Centre-0.46-0.290.710.66-0.17-0.16OLP
Mississauga South0.570.760.070.07-0.19-0.21OLP
Simcoe North-0.97-0.71-1.48-1.47-0.26-0.23PC
Brampton-Springdale-0.38-0.142.723.04-0.24-0.23OLP
Hamilton East-Stoney Creek-1.12-0.840.670.78-0.28-0.24NDP
Brampton West-0.43-0.122.143.07-0.30-0.30OLP
Renfrew-Nipissing-Pembroke-1.09-0.72-1.30-1.29-0.37-0.33PC
Haliburton-Kawartha Lakes-Brock-1.15-0.770.811.06-0.38-0.33PC
London-Fanshawe-1.13-0.750.220.19-0.38-0.33NDP
Mississauga-Streetsville0.590.89-0.45-0.48-0.29-0.34OLP
Windsor-Tecumseh-0.43-0.05-1.92-1.94-0.38-0.37OLP
Welland-0.95-0.53-1.91-1.76-0.42-0.38NDP
Lanark-Frontenac-Lennox and Addington-0.99-0.490.320.30-0.50-0.45PC
Leeds-Grenville-0.97-0.460.290.28-0.51-0.47PC
Northumberland-Quinte West-1.12-0.59-0.74-0.68-0.53-0.48PC
Chatham-Kent-Essex-1.14-0.552.272.15-0.60-0.54PC
Hamilton Mountain-0.96-0.280.750.75-0.67-0.64NDP
Brant-0.98-0.273.142.91-0.70-0.67OLP
Haldimand-Norfolk-1.25-0.441.091.06-0.81-0.75PC
Huron-Bruce-1.13-0.320.870.75-0.82-0.77PC
Oak Ridges-Markham0.761.38-0.72-0.69-0.63-0.78OLP
Lambton-Kent-Middlesex-1.18-0.320.510.54-0.86-0.81PC
Barrie-0.770.113.543.42-0.88-0.89PC
Burlington0.090.882.822.63-0.79-0.91PC
Perth-Wellington-1.14-0.19-1.37-1.18-0.95-0.92PC
Glengarry-Prescott-Russell-0.890.071.241.12-0.96-0.97OLP
Oshawa-1.19-0.18-0.83-0.73-1.01-0.98PC
Elgin-Middlesex-London-1.10-0.081.241.43-1.02-1.01PC
Oxford-1.18-0.14-1.32-1.15-1.05-1.02PC
Kitchener-Conestoga-0.590.380.660.66-0.97-1.04PC
Simcoe-Grey-0.870.14-1.81-1.52-1.01-1.04PC
Ancaster-Dundas-Flamborough-Westdale0.711.563.283.58-0.85-1.08OLP
Sarnia-Lambton-0.970.11-1.25-1.33-1.07-1.09PC
Cambridge-0.830.252.762.58-1.09-1.13PC
Nepean-Carleton0.861.91-0.52-0.53-1.04-1.39PC
Pickering-Scarborough East0.041.20-1.42-1.20-1.16-1.41OLP
Vaughan-0.261.07-1.35-1.75-1.34-1.59OLP
Ajax-Pickering-0.301.053.033.90-1.35-1.59OLP
Carleton-Mississippi Mills1.042.232.162.37-1.19-1.66PC
Niagara West-Glanbrook-0.630.83-0.65-0.67-1.47-1.68PC
York-Simcoe-1.030.51-2.63-2.56-1.55-1.69PC
Newmarket-Aurora0.291.73-0.52-0.59-1.44-1.88PC
Oakville1.102.45-0.66-0.72-1.35-1.93OLP
Dufferin-Caledon-0.670.991.771.90-1.66-1.95PC
Halton0.792.231.081.02-1.44-2.00PC
Ottawa-Orléans0.682.14-1.10-1.05-1.47-2.01OLP
Essex-0.651.171.341.38-1.82-2.19NDP
Whitby-Oshawa-0.261.49-2.14-1.81-1.75-2.21PC
Durham-0.841.031.801.76-1.87-2.21PC
Wellington-Halton Hills-0.381.46-1.72-1.80-1.84-2.32PC
Correlations with Party winner, 2011rr2
Correl 1 (Over-educated score, weighted)-0.220.05
Correl 2 (Over-educated score, unweighted)-0.240.06
Correl 3 (SuperRiding score weighted)0.140.02
Correl 4 (SuperRiding score, unweighted)0.150.02
Correl 5 (Income)-0.060.00
Correl 6 (Education)-0.330.11

Saturday 2 February 2013

Higher Education and Income - SuperRidings

All parts of Ontario are just as good as every other, of course, but some are filled with greater concentrations of educated people and income.

Having read Charles Murray's Coming Apart recently, we decided to apply his methodology for finding "SuperZips", the sections of the country he believes stand out on the top of the socioeconomic pile, to the Ontario data we have at hand. Obviously Census tract data would be more detailed and similar to what he did in his book, but this is a quick update to show what this kind of measure produces here in Ontario.

University of Toronto

Friday 1 February 2013

DINKs for McGuinty - The Liberal Party Secrets of Success

The buzz in the political world right now is centred around Kathleen Wynne's recent win as Ontario Liberal Party leader, and the date of the next election — possible at any time because of the minority government in Ontario. But for Wynne to win, she's going to need to keep those groups that have come to find a home in the party under Dalton McGuinty, and expand on their base.

MCGUINTY 20111002
Together, indeed

Recently we looked at sources of increased NDP support and big Dipper drops. We're going to use the same method to look at who swung to the Liberals in 2011 and helped keep them in government.

ShareThis

Read More from Ontario Projections